Outline of Page Content
Before starting your statistical review, review the information and videos on this page for a comprehensive guide to completing a statistical review.
Statistical reviews should follow the general principles of reviewing:
Read the entire paper and take notes.
Understand the journal guidelines.
Know the related literature - both clinical and statistical.
Review the study design, identify its flaws and data limitations:
Is the methodology appropriate?
For advanced methods determine if the methodology is within your skillset. If it's outside your expertise, you may prefer to decline or alert the editor before beginning.
Complete the detailed statistical review:
Go through each part of the manuscript—from the title and abstract to the conclusions, as well as all figures, tables and supplemental material—and provide specific feedback and recommendations where applicable.
Completing a Detailed Statistical Review
Like any review, you should read through each portion of the manuscript with specific questions. For a statistical review, you should keep the following questions in mind:
- Title page:
- Is the title supported by the data?
- Is a statistician in the author list?
- Abstract:
- Do the methods define the study group and general approach to analysis?
- Do the results contain data for each objective that supports conclusions?
- Are the conclusions supported by the data?
- Introduction
- Is the problem clearly stated? Is it important and is context provided?
- Are the objectives or purpose clear and congruent with the problem? Is there a hypothesis?
Methods
Patients:
- Are inclusion and exclusion criteria listed and justified?
- Are date ranges included?
- Number of patients listed -
- Are patient characteristics detailed, typically in a table?
Ethics:
- Is IRB approval information provided? In JTCVS, this should include the date and number of approval
- Are any conflicts of interest apparent
Study Design:
- Is the design appropriate to answer the study question?
- Are there enough patients and events?
- Are the endpoints of the study defined. If it's time-related, is goodness of follow-up detailed?
Statistical Methods:
- Are methods cited for each objective?
- Statistical tests should be identified by name.
- How were missing data handled?
- Do the statistical methods match the type of outcome data?
- For multivariable analyses - model diagnostics should be performed. See below for more information
Results:
- Are there results for each listed objective?
- Do the numbers add up? Identify any typos or errors in the tables - Reviewers should be able to reverse-engineer the analysis
- Do the results match what's provided in the abstract, tables, and figures? Data should match throughout the manuscript.
- Are time-related data analyzed by time-related methods? Follow-up data should include
- Are longitudinal, repeated measures data analyzed by mixed model methods? Time & results of tests and any competing risks
- Are confidence limits used appropriately? Typically 95% confidence intervals are reported.
- Are skewed data summarized and analyzed appropriately?
- Are there comparisons that need balancing scores?
- Do text results duplicate tables? Results should highlight important findings with tables detailing all data.
- Are full models and diagnostics available for review
Multivariable analyses:
- In general, a multivariable model can include one variable for every 10 outcomes
- Present multivariate analysis results in a Table
- Include all variables in the final model in the Table
- Linear regression (outcome: continuous variable)
- Report regression coefficients, standard errors of the coefficients and p values
- Report adjusted R2
- A test of how well the model accounts for the outcome
- Logistic Regression (outcome: dichotomous variable)
- Report odds ratios, 95% confidence intervals and p values
- Cox proportional hazards (outcome: hazard rate)
- Report hazard ratios, 95% confidence intervals and p values
Tables
- Are appropriate summary statistics provided?
- Are numbers properly rounded?
- Confidence limits used effectively
- Row statistics or column statistics presented as appropriate
- Do the numbers add up?
Figures:
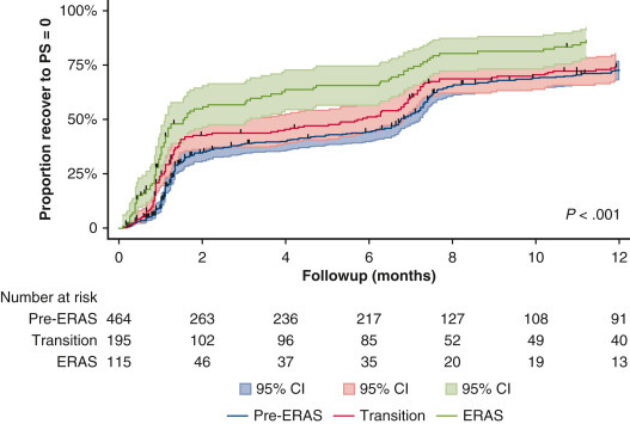
- Do actuarial curves have confidence limits periodically and number at risk? Typically truncate at 10% or fewer
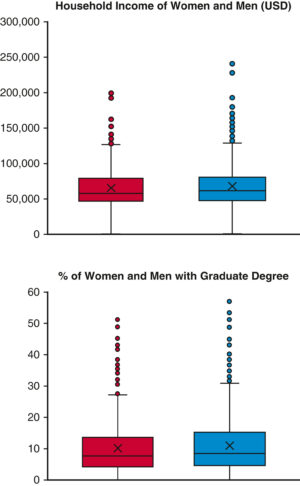
- Continuous data presented as box-and-whisker plots? If few data points (<10), all data points plotted?
- For JTCVS - authors should use color to aid interpretation.

From Preventza O, Akpan-Smart E, Simpson KK, Cornwell LD, Amarasekara HS, Green SY, Chatterjee S, LeMaire SA, Coselli JS. The intersection of community socioeconomic factors with gender on outcomes after thoracic aortic surgery. The Journal of Thoracic and Cardiovascular Surgery. 2022;in press.

From Nelson DR, Mehran RJ, Mena GE, Hofstetter WL, Vaporciyan AA, Antonoff MB, Rice DC. Enhanced recovery after surgery improves postdischarge recovery after pulmonary lobectomy. The Journal of Thoracic and Cardiovascular Surgery. 2022;165(5):1731-1740.e5.
Discussion:
- Are the claims supported by the results? Are any new results presented?
- Are limitations properly identified?
- Are conclusions supported?
What JTCVS Editors Consider an Excellent Statistical Reviewer
- An attention to detail (identify when numbers don't match up and detect subtle methodological mistakes)
- Specific feedback provided to improve the methods. The issues are identified but more importantly, solutions are provided
- Insight or limitations provided about any advanced or lesser known methods
- Timely response to invitations
