Optional Multimedia Items
The Editors request graphical abstracts, videos and/or video abstracts because they offer educational benefits to readers and significantly aid in the promotion and dissemination of the published work. We aim to use the digital media authors create as featured content on our journal websites, in our e-alerts, and on social media to help promote articles. These elements are meant to be visually stimulating and thus should be high-resolution, colorful, and well-edited.
Requirements for Figures and Tables
Below are the most common technical items that authors need to address prior to publication.
Graphical Abstracts
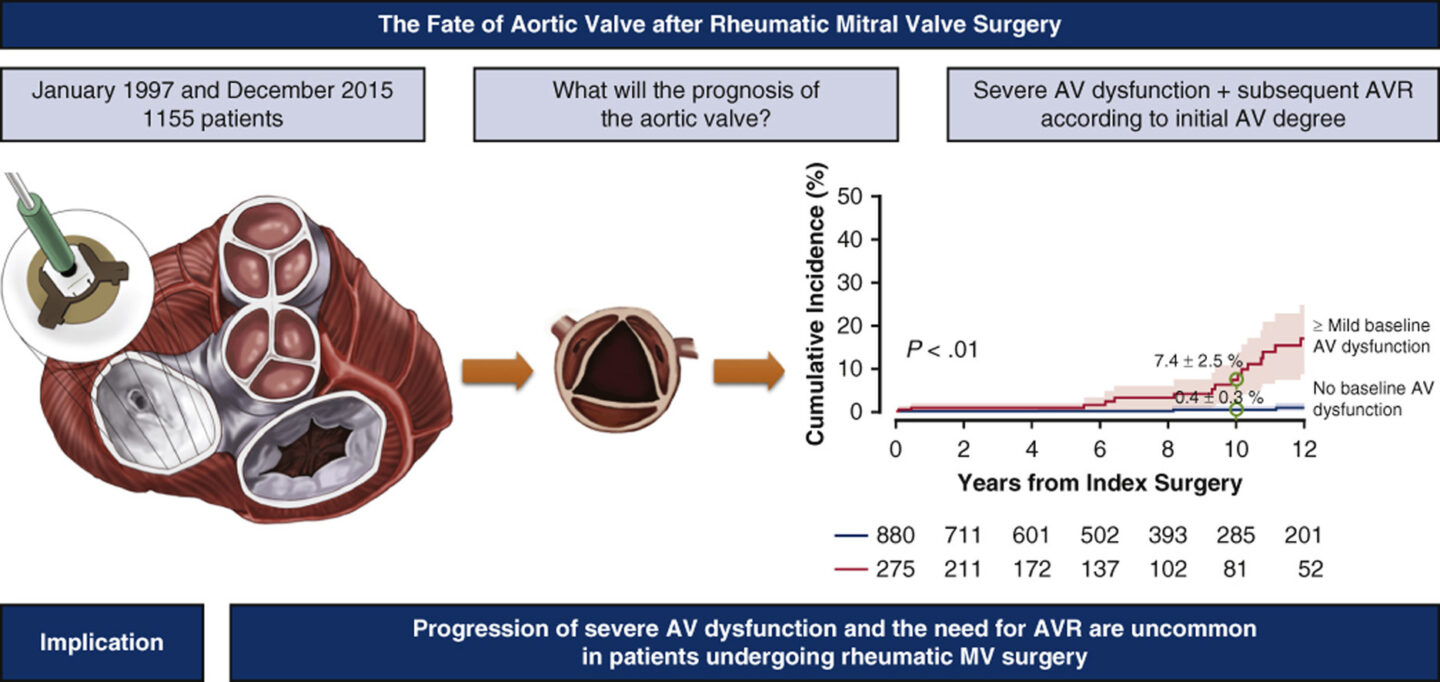
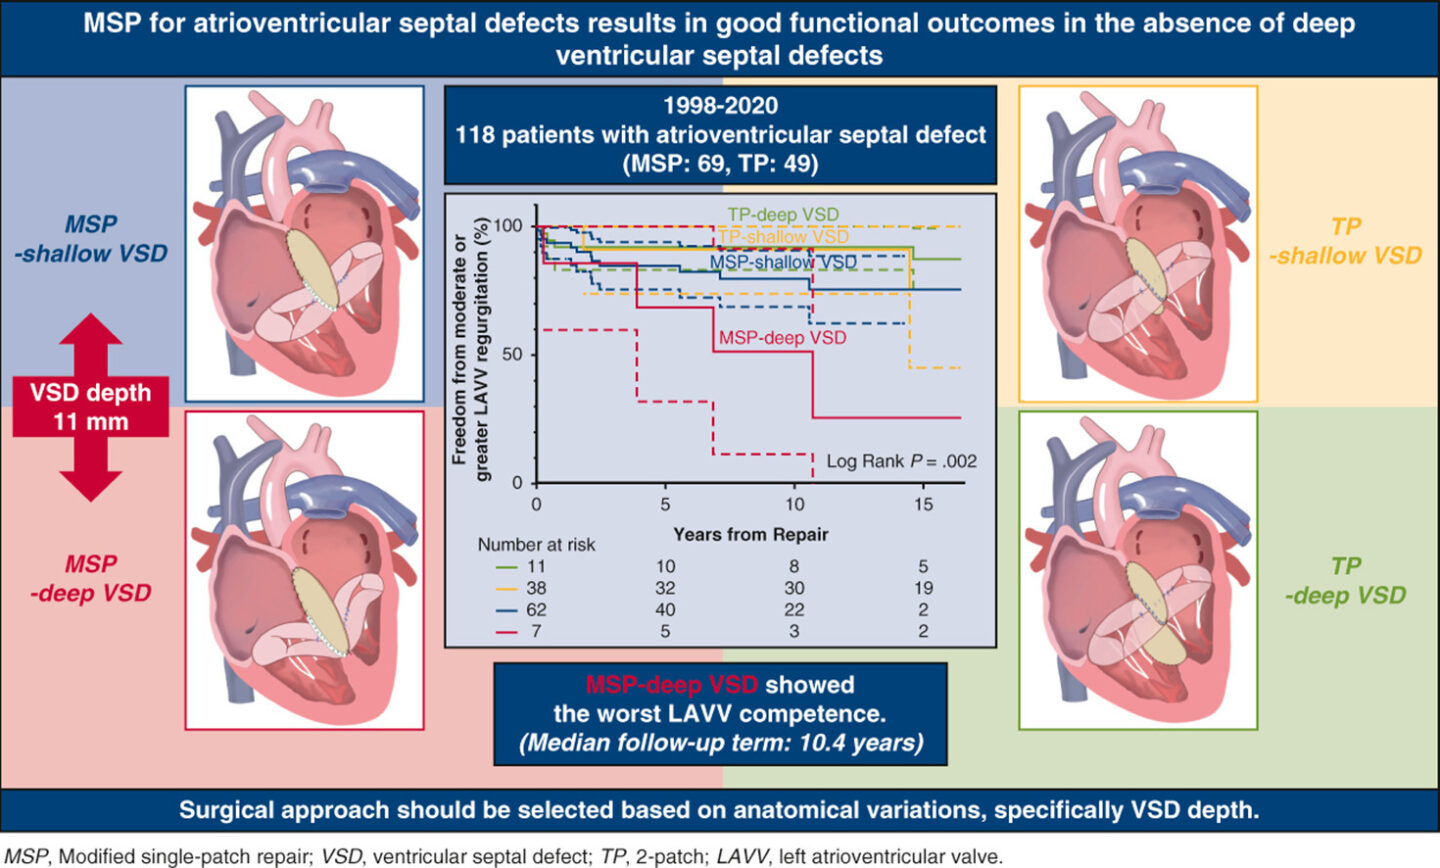
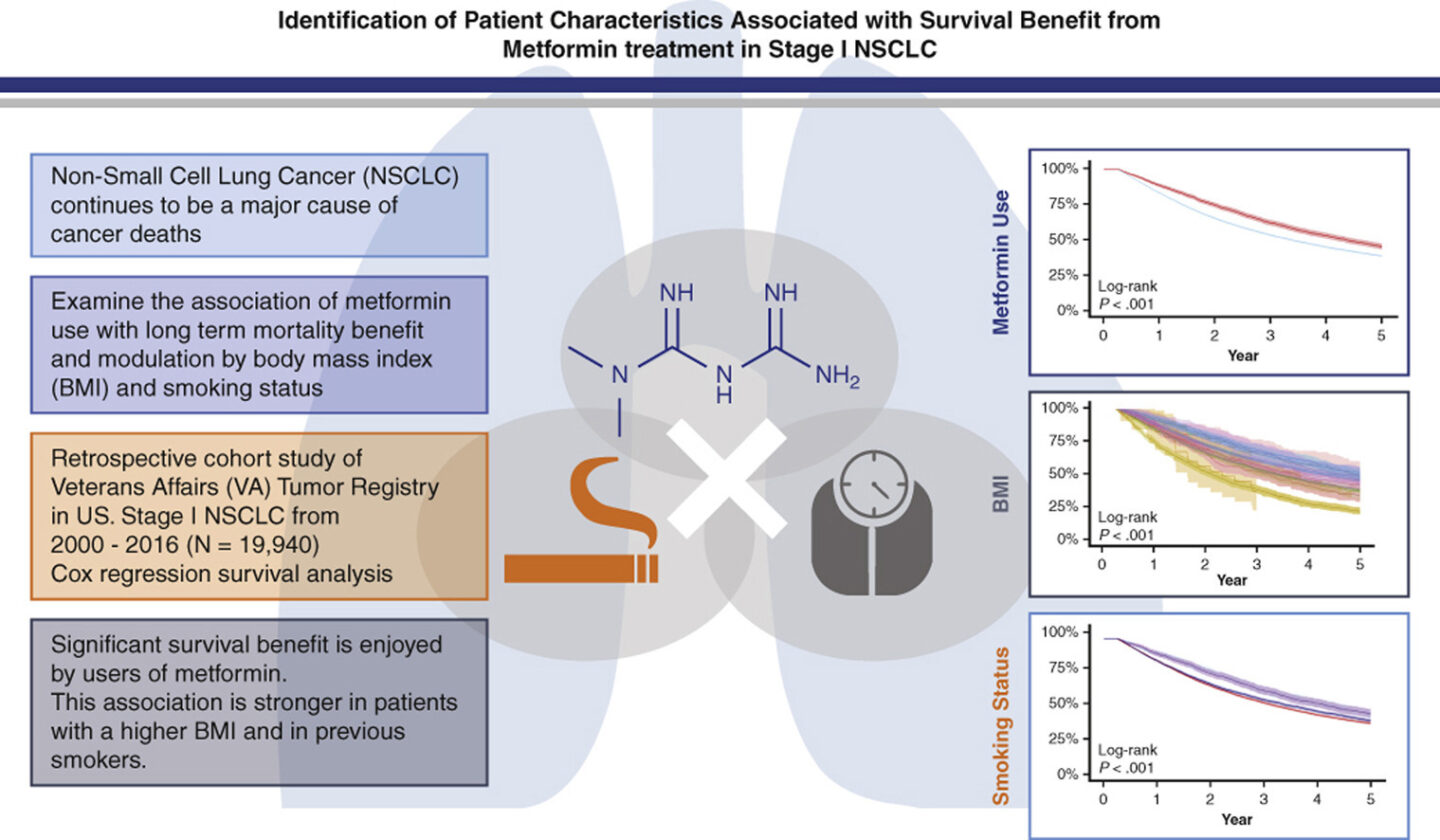
A graphical abstract is a visual summary of a paper that allows readers to quickly identify the paper’s main points. Similar to a pictorial flowchart, this image depicts the paper’s Methods, Results, and the Implications of those results. All three areas must be clearly addressed (methods = number of subjects and measurements; results = main outcome; implications = how your study will impact clinical care). These three sections should be arranged either from left to right or from top to bottom. The Graphical Abstract must include at least one illustration or figure to make it “visual.”
A built-in descriptive title must be provided at the top of the image. This title must describe the figure as a whole so that readers can understand the Graphical Abstract independent of the paper.
Please include words describing your study’s Methods, Results, and Implications. Importantly, the image must include an Implications statement (a take-home message). This statement should explain the implications of your results and/or suggest how your study can be applied to clinical care. Authors commonly provide this statement across the bottom of the image (or on the right side of the image).
Any abbreviations/acronyms in the Graphical Abstract must be defined at the very bottom of the image. This is important because Graphical Abstracts are displayed in two ways: 1) in print, with a legend, and 2) online, without a legend. See an instructional diagram for graphical abstracts here.
Below are examples of high-quality graphical abstracts:
Video Abstracts
Video abstracts are optional and will not impact the editors' final decision on the paper. Video abstracts must meet the requirements listed below. If the video abstract does not meet the requirements, we may not publish the video abstract with the accepted paper.
An effective Video Abstract provides an intriguing preview of a paper, making the viewer want to read the article. Video Abstracts should focus mainly on the study's key results and implications. Video Abstracts should be 60 seconds or less and should feature narration. See the video below as an example.
Importantly, Video Abstracts should feature lively motion graphics; dynamic visuals should be used instead of static slides. Authors should aim to submit a professional production with a polished tone and feel. Video Abstracts, like Graphical Abstracts, are entirely optional but are useful for promoting papers via our journal websites, e-alerts, and social media pages.
Video Abstract Requirements:
1. 60 seconds or less
2. .MP4 format
3. Please include the words "Video Abstract" when naming the video file, and upload under item type "Video Abstract” in the drop-down menu.
4. In the body of the manuscript, please call out the video abstract by using the words "Video Abstract."
Video Abstracts Must include:
1. A title screen featuring the manuscript's title, authors, and institutions
2. A brief preview of the paper focusing mainly on the key results and implications
3. High-quality motion graphics (rather than static slides)
4. Audio (voice-over or author explanation)
Video Abstracts Must Not include:
1. Music
2. The name/logo of any AATS journal
Surgical & Imaging Videos
Authors are strongly encouraged to submit high-quality videos of surgeries, imaging procedures, and demonstrations of clinical and laboratory work when submitting a revised manuscript. Although not a condition of publication, a video would enhance your submission. Please also include a Video Legend in the Legends section of your manuscript Word document. In addition, please call out the video within the body of the manuscript.
AATS Journals have moved away from videos of authors speaking from their desks and from study presentations via numerous PowerPoint slides. If authors wish to discuss key results and their implications, they are encouraged to do so by creating a concise, dynamic Video Abstract.
Figure Tips
All figures must be submitted in color and uploaded as individual image files (such as .png, .tif, .jpg, or .eps).
For your revision, we encourage you to provide high-quality graphics for your figures. Line art and illustration need to be at 1200 dpi resolution, and photographs must be at 300 dpi resolution.
Lines should be thick and distinctive. Our Information for Authors suggests that you should use graphics software such as Photoshop or Illustrator to create the figures and not presentation software such as PowerPoint or statistical software such as Excel. The colors will be modified to be consistent with the Journal palette.
Avoid using dark backgrounds or embedding legends or figure numbers into the images themselves.
Time-Varying Outcome Graphs
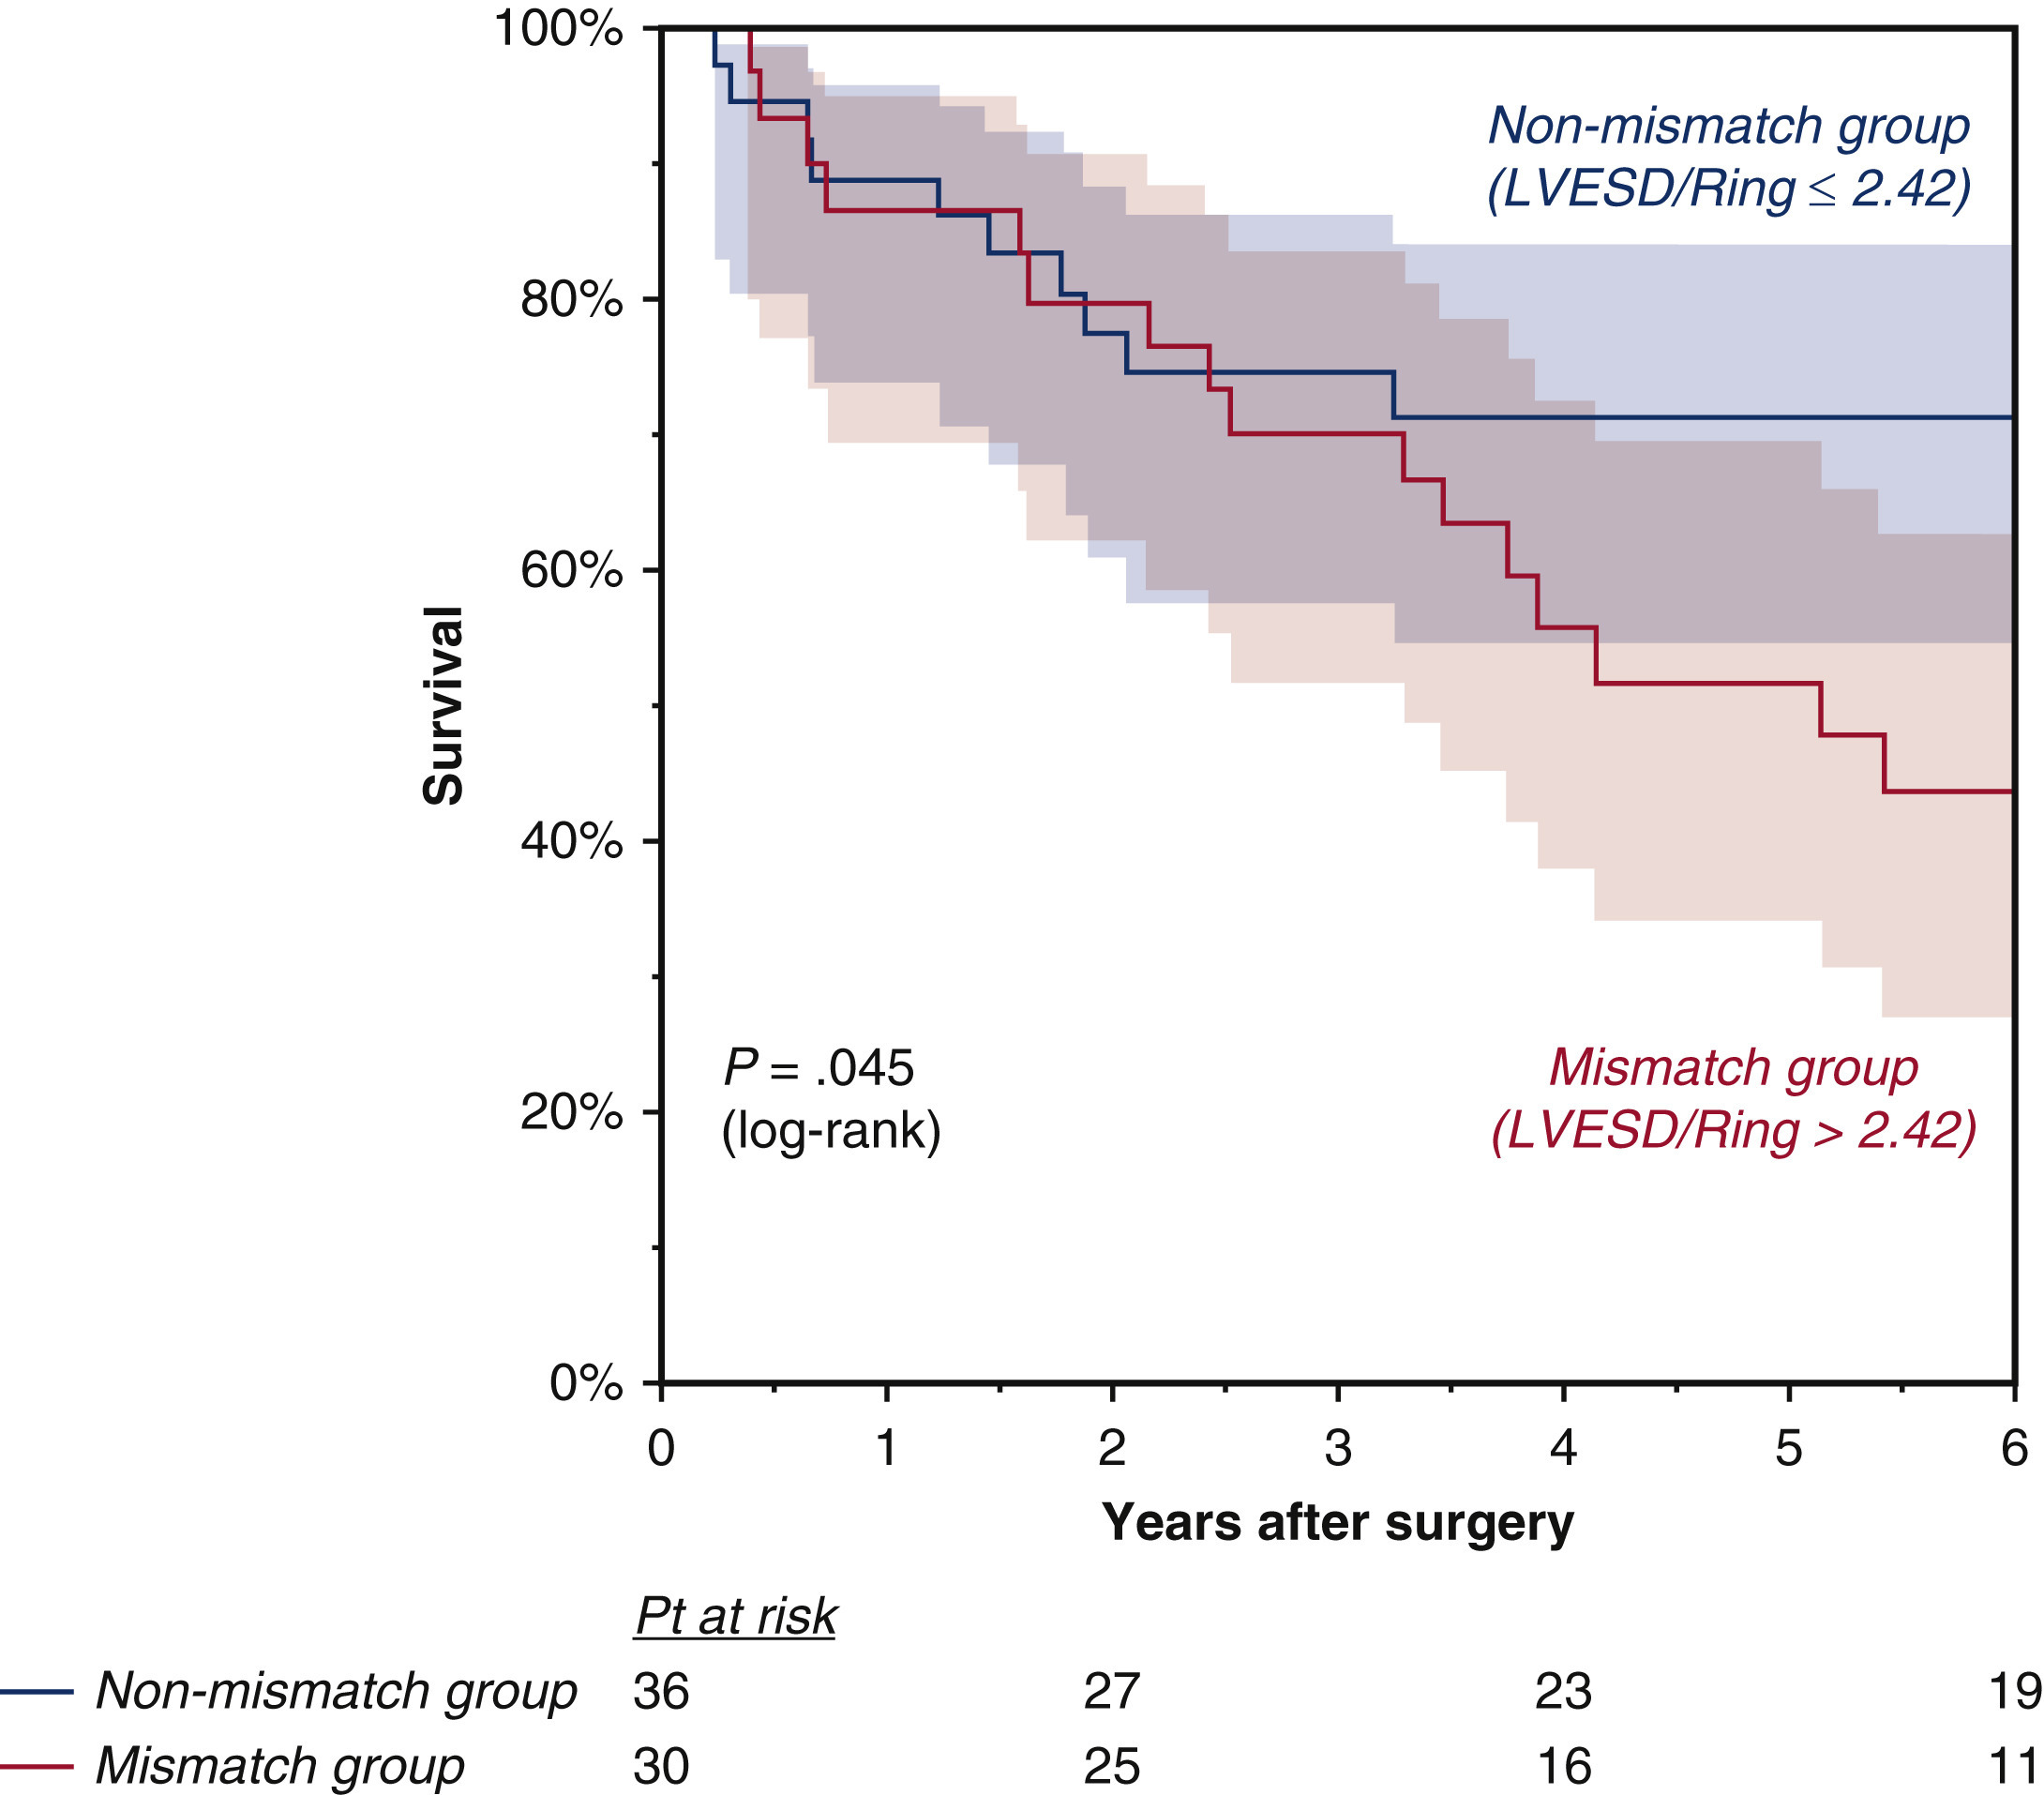
Time-varying outcome graphs meet the following five requirements:
- The Y axis must be in percentage (from 0% to 100% rather than 0.0 to 1.0) and the X axis must be in years rather than months.
- For time periods of less than two years, months/days is acceptable.
- The number of subjects at risk must be shown periodically along the X axis.
- The confidence limits must be shown (via shading, bars, or dotted lines). Alternately, the confidence limits can be shown via a small table at the bottom of the graph (with the numbers of subjects at risk). As another option, the confidence limits can be displayed as a supplementary (online-only) table, which must be called out in the corresponding figure legend.
- The confidence limits must be defined (e.g. 95%, 97%), ideally in the white space of the graph itself (or in the figure legend).
- The individual graph lines must be truncated (stopped) before the number of subjects at risk falls to fewer than 10. If a cohort is small in comparison to the other groups, please end the graph line before the number of subjects at risk falls to less than 10% of the starting number for that group.
Plotting Continuous Data
Continuous data should be plotted as box-and-whiskers dot plots rather than as bar graphs.
- The meaning of the box, whiskers, and horizontal line must be defined in the legend. Usually, the lower and upper borders of the box represent the lower and upper quartiles (25th percentile and 75th percentile).
- The middle horizontal line represents the median.
- The lower and upper whiskers represent the minimum and maximum values of non-outliers. Extra dots represent outliers.
- If the number of subjects or measurements is 14 or fewer, then each value must be plotted (as different-colored dots).
Tables
- Tables must be provided in editable Microsoft Word format (not as image files).
- Tables must be self-explanatory and should supplement, not duplicate, the text.
- Each table should include a brief title.
- All abbreviations/acronyms used in a table must be defined beneath the table.
Central Pictures
Because it will appear as a 3.5 cm x 5 cm thumbnail, the Central Picture must be a very simple image that is highly pictorial (as opposed to text-heavy). We recommend a simple, single-frame image. The Central Picture appears on the Table of Contents and on the first page of published papers, so it is intended to grab the reader's attention and provide a quick snapshot of the paper. Medical illustrations/photography/imaging (or high-quality medical clipart) may be useful for this purpose.
If a Central Picture is more complex, we recommend also providing the image as a regular numbered figure. This will allow the reader to appreciate the image at full size. If you choose to proceed with this option, you must upload the image both as a Central Picture item as well as a figure file. The figure must be called out in the manuscript and include a full figure legend with definitions for all abbreviations/acronyms that appear within the image.
Figure Legends
For all figures, please provide a full, descriptive legend detailing the contents of the image and their significance. All abbreviations/acronyms used in the figure must be defined in the legend. The aim is for readers to understand individual figures without reading the manuscript.